Through its activities in the development of methods for treating brain tumors using multifunctional nanoparticles, the CRAN has equipped itself with a platform for rapid analysis of the size distribution (hydrodynamic diameter between 10 nm and 1 μm) and concentration of these small particles in suspension (from 106 to 109 particles per mL). This equipment allows for a rigorous characterization of nanoparticles in vitro prior to their in vivo toxicological study. The results show that size is one of the elements that influences both the distribution of nanoparticles in the body and their cytotoxicity, both in vitro and in vivo (Projects: PHOTOBrain, PDTX, NanoBIT).
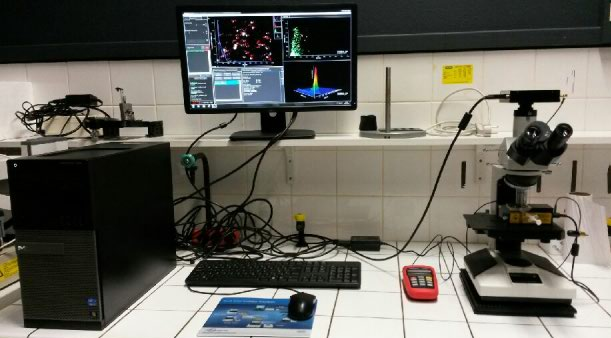
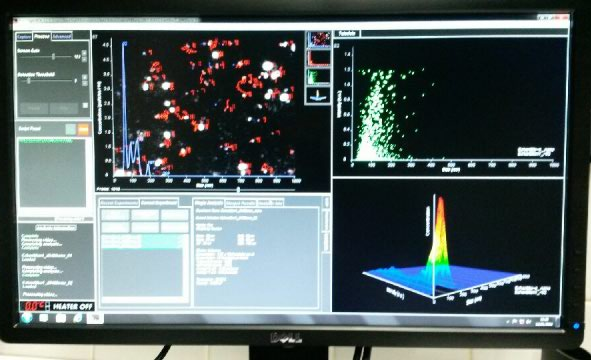
The operating principle of the Nanosight LM10 (Malvern Instrument) is based on the technology of individual particle tracking analysis (Nanoparticle Tracking Analysis or NTA). This exclusive technology combines the light scattering properties and Brownian motion of particles. A laser beam (405 nm) passes through the sample chamber and the particles in suspension present on the path of this beam scatter the light in such a way that they can be easily visualized with a microscope with a 20x magnification, equipped with a CCD camera. The camera operates at a frequency of 30 frames per second, and records a video file of the particles subjected to Brownian motion. The software (Nanosight NTA 3.1) identifies the particles individually and calculates their hydrodynamic diameter using the Stokes-Einstein equation.